![]()
15: Matplotlib Top Graphs#
import numpy as np
import matplotlib.pyplot as plt
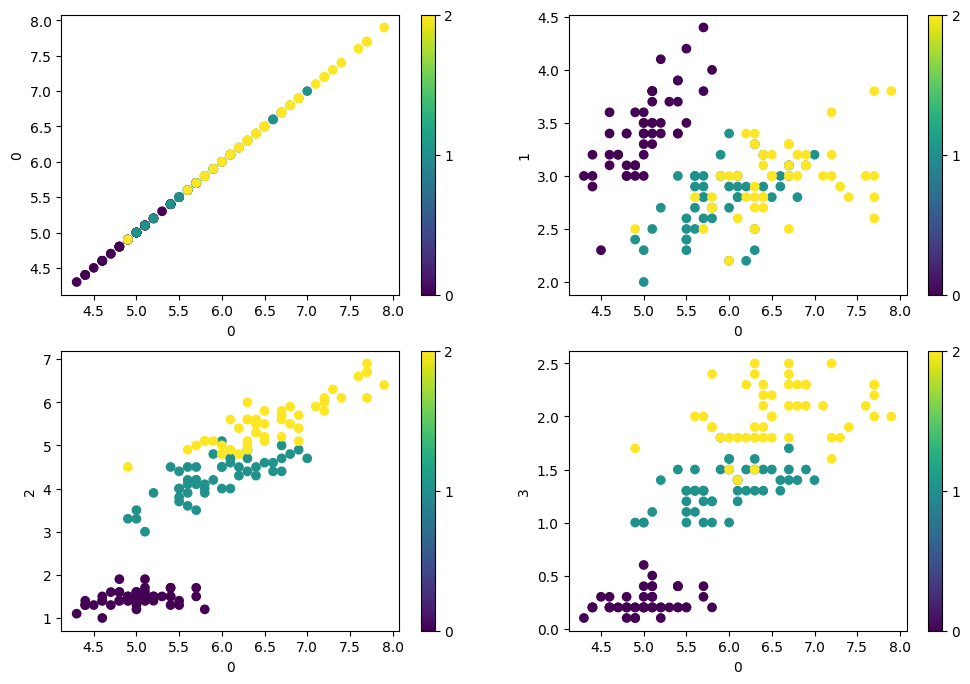
1.Classification Graph with Scatter()#
from sklearn.datasets import load_iris
iris = load_iris()
x = iris.data
y = iris.target

print(f'x contains {x.shape[0]} examples and {x.shape[1]} variabels')
print(f'There are {np.unique(y).size} classes')
x contains 150 examples and 4 variabels
There are 3 classes
n = x.shape[1]
plt.figure(figsize=(12, 8))
for i in range(n):
    plt.subplot(n//2, n//2, i+1)
    plt.scatter(x[:, 0], x[:, i], c=y)
    plt.xlabel('0')
    plt.ylabel(i)
    plt.colorbar(ticks=list(np.unique(y)))
plt.show()
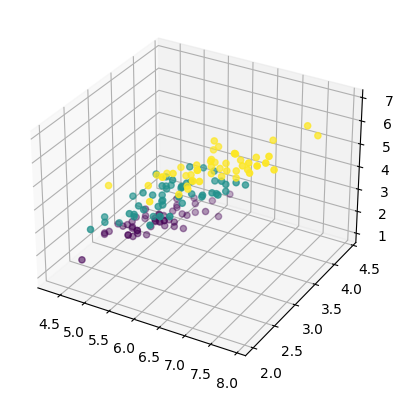
2. 3D Graph#
from mpl_toolkits.mplot3d import Axes3D
ax = plt.axes(projection='3d')
ax.scatter(x[:, 0], x[:, 1], x[:,2], c=y)
<mpl_toolkits.mplot3d.art3d.Path3DCollection at 0x7f6f0bdb36d0>
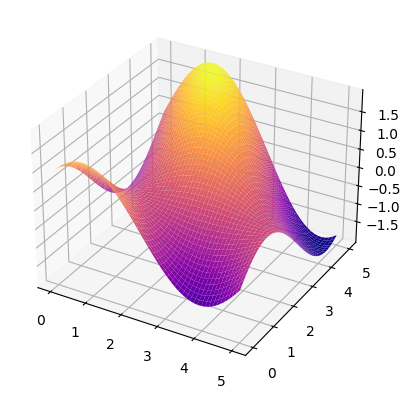
f = lambda x, y: np.sin(x) + np.cos(x+y)

X = np.linspace(0, 5, 50)
Y = np.linspace(0, 5, 50)
X, Y = np.meshgrid(X, Y)
Z = f(X, Y)

ax = plt.axes(projection='3d')
ax.plot_surface(X, Y, Z, cmap='plasma')
plt.show()
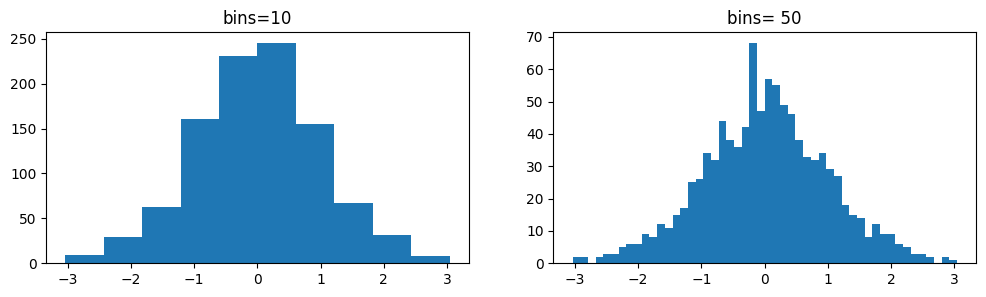
3. Histograms#
x = np.random.randn(1000)

plt.figure(figsize=(12, 3))
plt.subplot(121)
plt.hist(x, bins=10)
plt.title('bins=10')
plt.subplot(122)
plt.hist(x, bins=50)
plt.title('bins= 50')
plt.show()
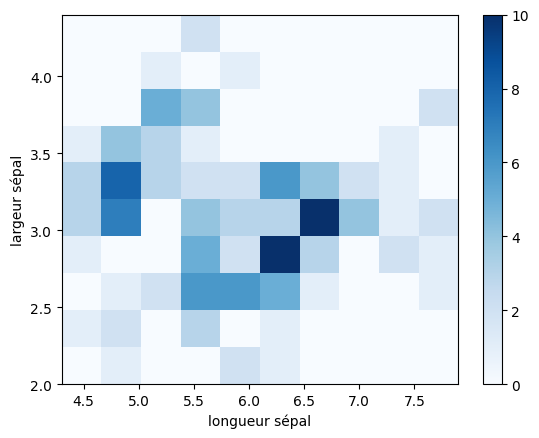
x = iris.data

plt.hist2d(x[:,0], x[:,1], cmap='Blues')
plt.xlabel('longueur sépal')
plt.ylabel('largeur sépal')
plt.colorbar()
<matplotlib.colorbar.Colorbar at 0x7f6f0bae3040>
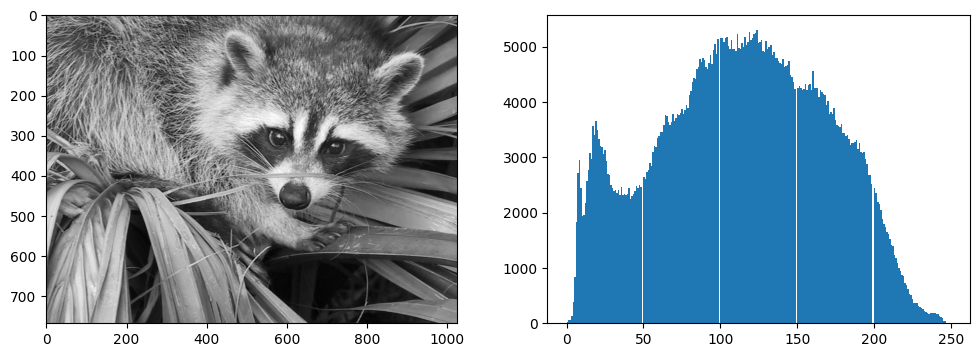
# Image histogram
from scipy import misc
face = misc.face(gray=True)

plt.figure(figsize=(12, 4))
plt.subplot(121)
plt.imshow(face, cmap='gray')
plt.subplot(122)
plt.hist(face.ravel(), bins=255)
plt.show()
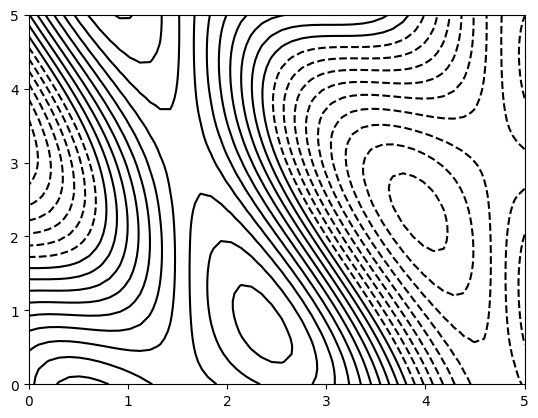
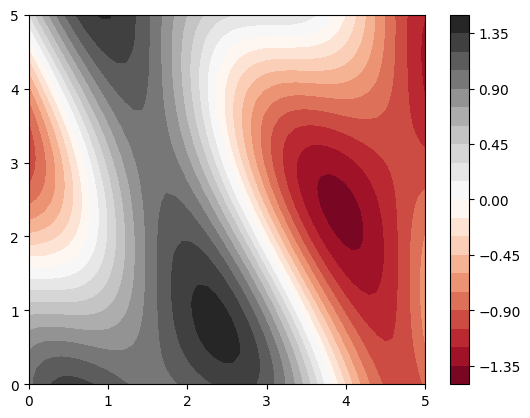
4. ContourPlot()#
f = lambda x, y: np.sin(x) + np.cos(x+y)*np.cos(x)

X = np.linspace(0, 5, 50)
Y = np.linspace(0, 5, 50)
X, Y = np.meshgrid(X, Y)
Z = f(X, Y)

plt.contour(X, Y, Z, 20, colors='black')
<matplotlib.contour.QuadContourSet at 0x7f6f09704be0>
plt.contourf(X, Y, Z, 20, cmap='RdGy')
plt.colorbar()
<matplotlib.colorbar.Colorbar at 0x7f6f0839be20>
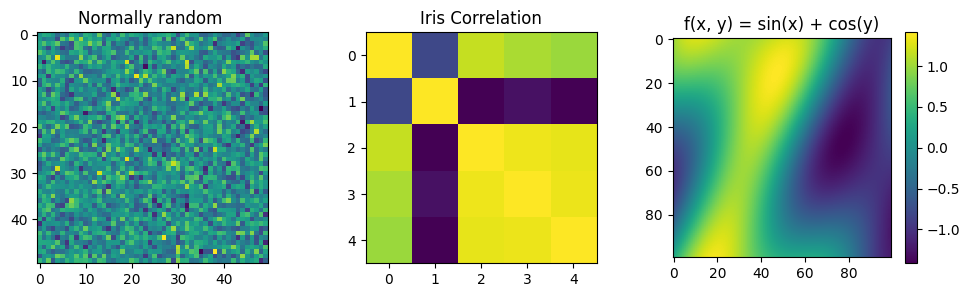
5. Imshow()#
plt.figure(figsize=(12, 3))

# Simple graphique imshow()
X = np.random.randn(50, 50)

plt.subplot(131)
plt.imshow(X)
plt.title('Normally random ')

# Matrice de corrélation des iris
from sklearn.datasets import load_iris
iris = load_iris()
X = iris.data
y = iris.target


plt.subplot(132)
plt.imshow(np.corrcoef(X.T, y))
plt.title('Iris Correlation')

# Matrice f(X, Y) = sin(X) + cos(Y)
X = np.linspace(0, 5, 100)
Y = np.linspace(0, 5, 100)
X, Y = np.meshgrid(X, Y)

plt.subplot(133)
plt.imshow(f(X, Y))
plt.colorbar()
plt.title('f(x, y) = sin(x) + cos(y)')
Text(0.5, 1.0, 'f(x, y) = sin(x) + cos(y)')