![]()
19: Data Visualisation with Seaborn#
import numpy as np
import matplotlib.pyplot as plt
import pandas as pd
import seaborn as sns
%matplotlib inline
iris = sns.load_dataset('iris')
iris.head()
| sepal_length | sepal_width | petal_length | petal_width | species | |
|---|---|---|---|---|---|
| 0 | 5.1 | 3.5 | 1.4 | 0.2 | setosa |
| 1 | 4.9 | 3.0 | 1.4 | 0.2 | setosa |
| 2 | 4.7 | 3.2 | 1.3 | 0.2 | setosa |
| 3 | 4.6 | 3.1 | 1.5 | 0.2 | setosa |
| 4 | 5.0 | 3.6 | 1.4 | 0.2 | setosa |
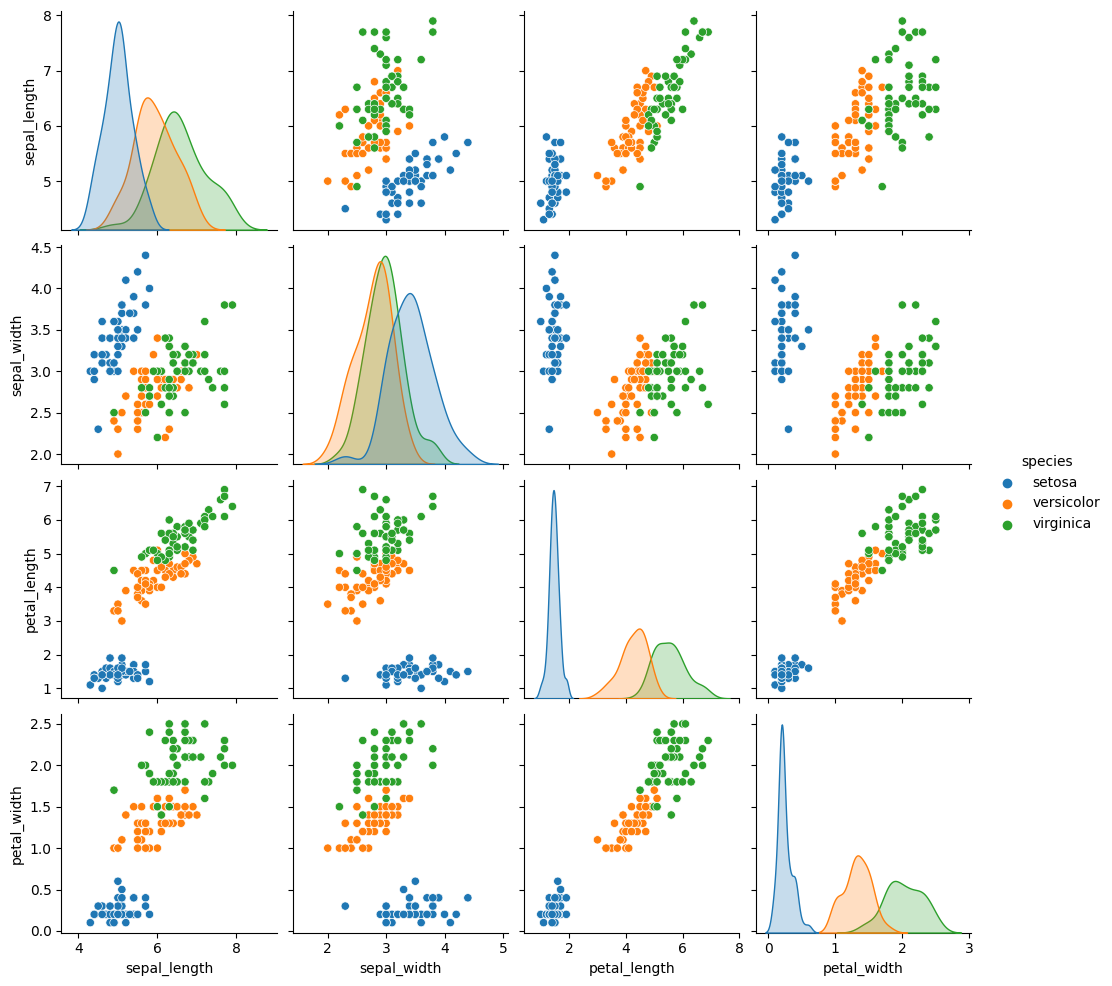
1. Pairplot() : Global pictrue#
sns.pairplot(iris, hue='species')
<seaborn.axisgrid.PairGrid at 0x7fc6e4b54670>
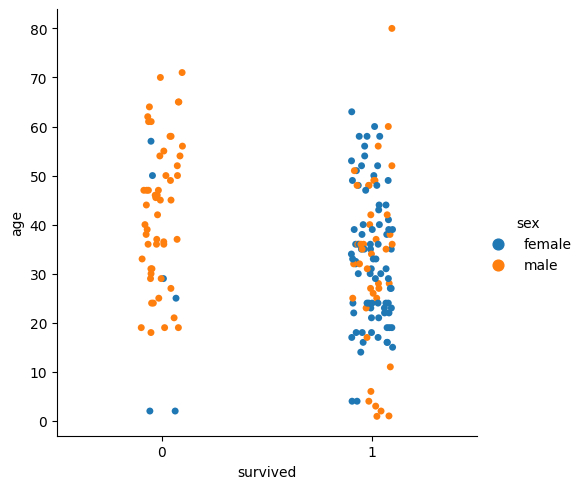
2. Categories Viewing#
titanic = sns.load_dataset('titanic')
titanic.drop(['alone', 'alive', 'who', 'adult_male', 'embark_town', 'class'], axis=1, inplace=True)
titanic.dropna(axis=0, inplace=True)
titanic.head()
| survived | pclass | sex | age | sibsp | parch | fare | embarked | deck | |
|---|---|---|---|---|---|---|---|---|---|
| 1 | 1 | 1 | female | 38.0 | 1 | 0 | 71.2833 | C | C |
| 3 | 1 | 1 | female | 35.0 | 1 | 0 | 53.1000 | S | C |
| 6 | 0 | 1 | male | 54.0 | 0 | 0 | 51.8625 | S | E |
| 10 | 1 | 3 | female | 4.0 | 1 | 1 | 16.7000 | S | G |
| 11 | 1 | 1 | female | 58.0 | 0 | 0 | 26.5500 | S | C |
sns.catplot(x='survived', y='age', data=titanic, hue='sex')
<seaborn.axisgrid.FacetGrid at 0x7fc6dfc6eaf0>
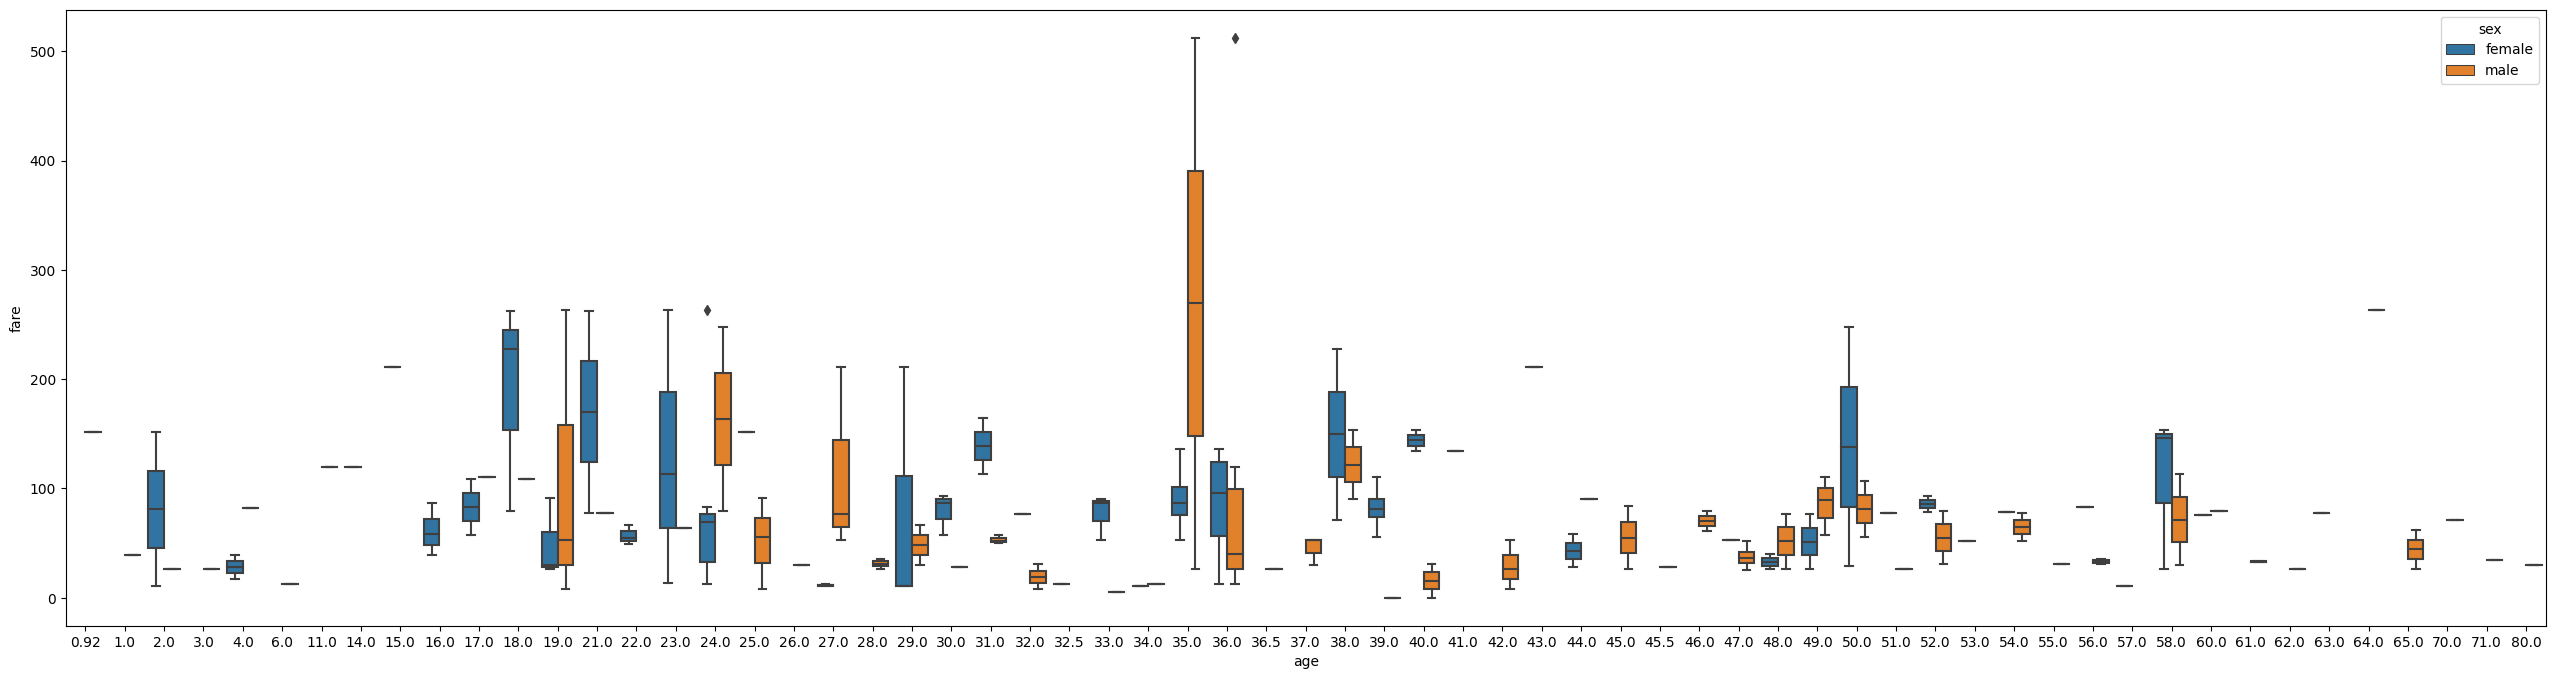
plt.figure(figsize=(32, 8))
sns.boxplot(x='age', y='fare', data=titanic, hue='sex')
<AxesSubplot:xlabel='age', ylabel='fare'>
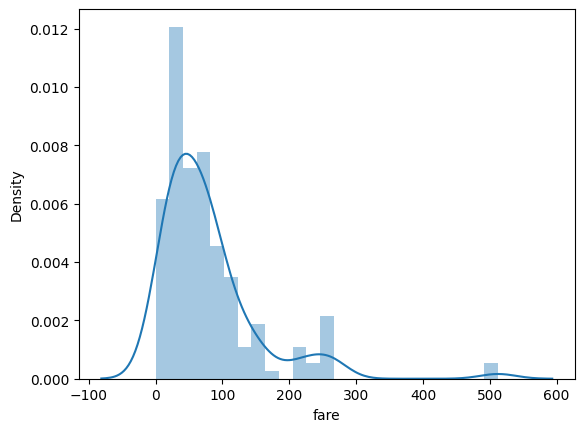
3. Visualisation de Distributions#
sns.distplot(titanic['fare'])
/home/ubuntu/Documents/Projects/msci_data/.venv/lib/python3.9/site-packages/seaborn/distributions.py:2619: FutureWarning: `distplot` is a deprecated function and will be removed in a future version. Please adapt your code to use either `displot` (a figure-level function with similar flexibility) or `histplot` (an axes-level function for histograms).
  warnings.warn(msg, FutureWarning)
<AxesSubplot:xlabel='fare', ylabel='Density'>
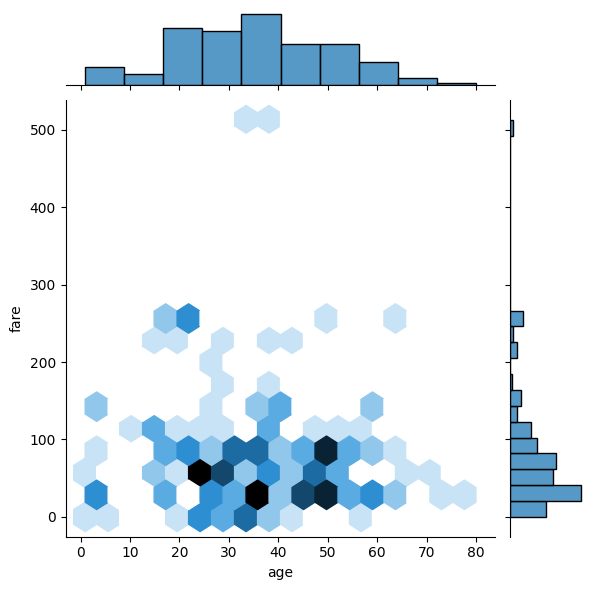
sns.jointplot('age', 'fare', data=titanic, kind='hex')
/home/ubuntu/Documents/Projects/msci_data/.venv/lib/python3.9/site-packages/seaborn/_decorators.py:36: FutureWarning: Pass the following variables as keyword args: x, y. From version 0.12, the only valid positional argument will be `data`, and passing other arguments without an explicit keyword will result in an error or misinterpretation.
  warnings.warn(
<seaborn.axisgrid.JointGrid at 0x7fc6dfc8bc40>
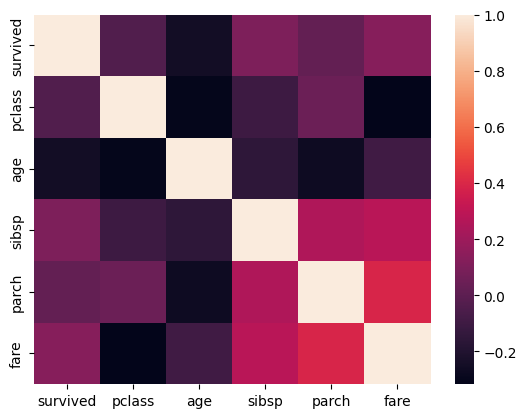
sns.heatmap(titanic.corr())
<AxesSubplot:>