import pandas as pd
from datetime import datetime
import matplotlib.pyplot as plt
import os
data_folder = '../data/'
4: Read the Data#
def parser(s):
    return datetime.strptime(s, '%Y-%m')
ice_cream_heater_df = pd.read_csv(os.path.join(data_folder, 'ice_cream_vs_heater.csv'),
                                  parse_dates=['Month'], index_col='Month'))
ice_cream_heater_df.head()
| heater | ice cream | |
|---|---|---|
| Month | ||
| 2004-01-01 | 27 | 13 |
| 2004-02-01 | 18 | 15 |
| 2004-03-01 | 14 | 16 |
| 2004-04-01 | 13 | 19 |
| 2004-05-01 | 13 | 21 |
heater_series = ice_cream_heater_df.heater
heater_series
Month
2004-01-01    27
2004-02-01    18
2004-03-01    14
2004-04-01    13
2004-05-01    13
              ..
2020-02-01    34
2020-03-01    25
2020-04-01    25
2020-05-01    27
2020-06-01    24
Freq: MS, Name: heater, Length: 198, dtype: int64
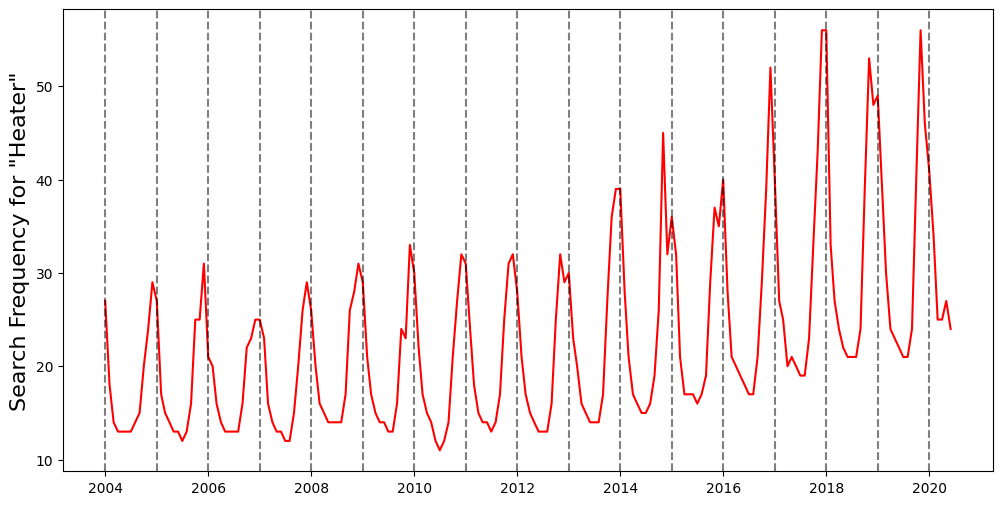
def plot_series(series):
    plt.figure(figsize=(12,6))
    plt.plot(heater_series, color='red')
    plt.ylabel('Search Frequency for "Heater"', fontsize=16)

    for year in range(2004, 2021):
        plt.axvline(datetime(year,1,1), linestyle='--', color='k', alpha=0.5)
plot_series(heater_series)
Normalize#
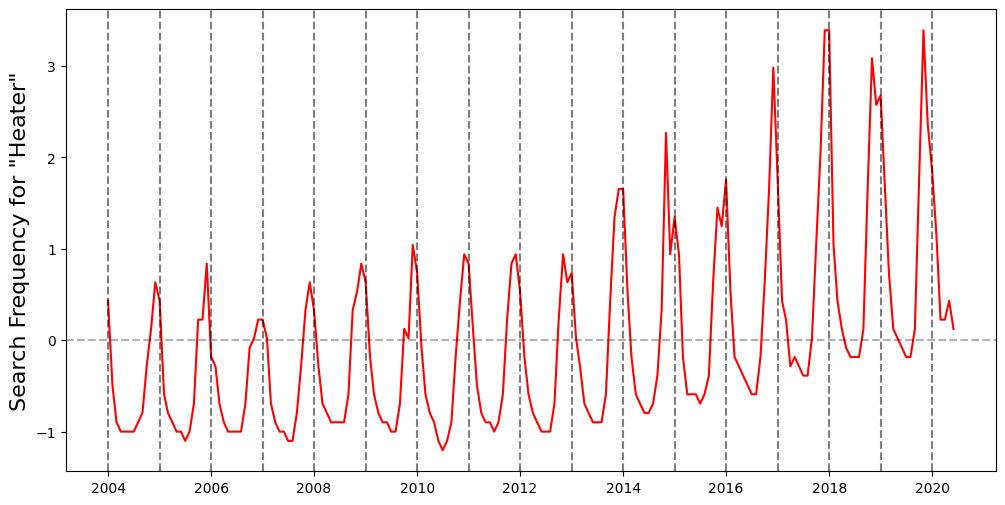
avg, dev = heater_series.mean(), heater_series.std()
heater_series = (heater_series - avg) / dev
plot_series(heater_series)
plt.axhline(0, linestyle='--', color='k', alpha=0.3)
<matplotlib.lines.Line2D at 0x7f6680068910>
Take First Difference to Remove Trend#
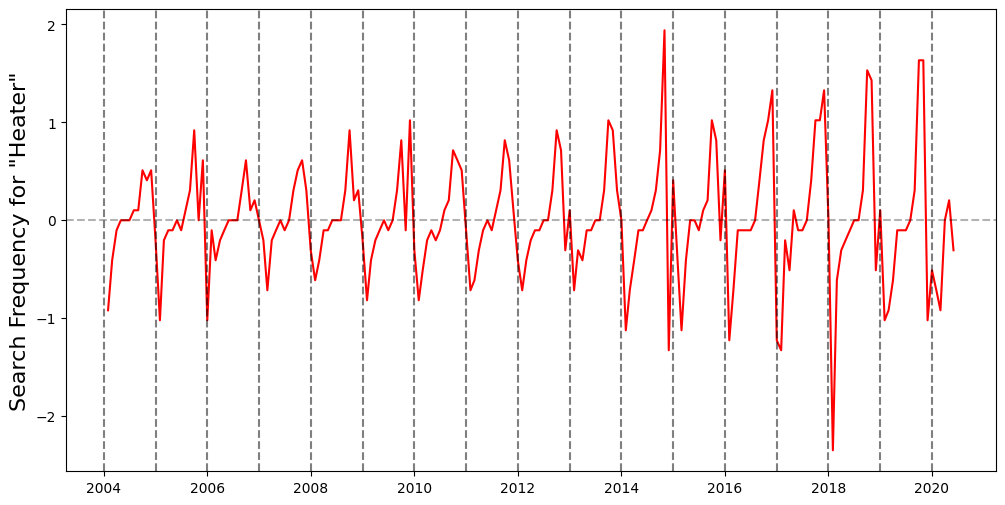
heater_series = heater_series.diff().dropna()
plot_series(heater_series)
plt.axhline(0, linestyle='--', color='k', alpha=0.3)
<matplotlib.lines.Line2D at 0x7f6680068a30>
Remove Increasing Volatility#
annual_volatility = heater_series.groupby(heater_series.index.year).std()
annual_volatility
Month
2004    0.415481
2005    0.474527
2006    0.400148
2007    0.359839
2008    0.396182
2009    0.499810
2010    0.459566
2011    0.443924
2012    0.471104
2013    0.503587
2014    0.855743
2015    0.569441
2016    0.719843
2017    0.830886
2018    0.987221
2019    0.892991
2020    0.426657
Name: heater, dtype: float64
heater_annual_vol = heater_series.index.map(lambda d: annual_volatility.loc[d.year])
heater_annual_vol
Float64Index([0.41548104705328837, 0.41548104705328837, 0.41548104705328837,
              0.41548104705328837, 0.41548104705328837, 0.41548104705328837,
              0.41548104705328837, 0.41548104705328837, 0.41548104705328837,
              0.41548104705328837,
              ...
               0.8929910269067829,  0.8929910269067829,  0.8929910269067829,
               0.8929910269067829, 0.42665652301411994, 0.42665652301411994,
              0.42665652301411994, 0.42665652301411994, 0.42665652301411994,
              0.42665652301411994],
             dtype='float64', name='Month', length=197)
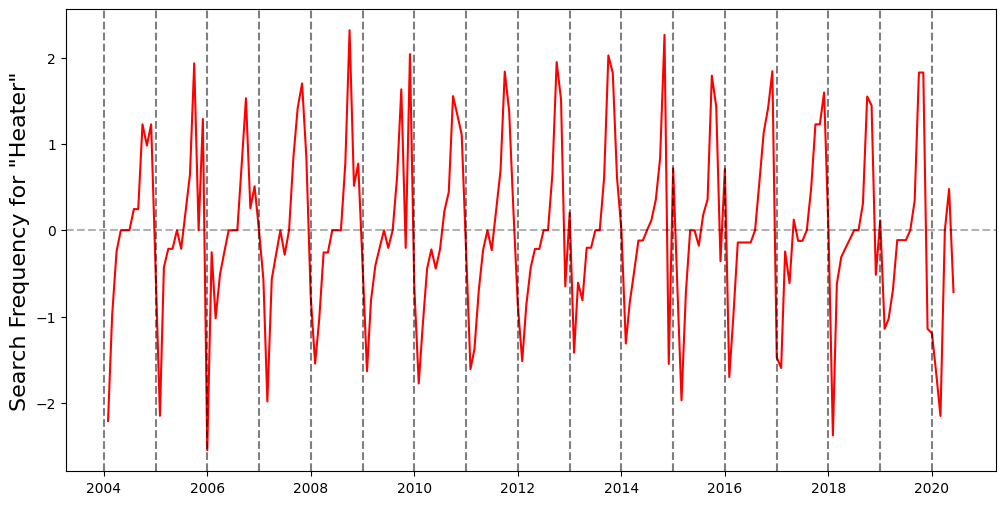
heater_series = heater_series / heater_annual_vol
plot_series(heater_series)
plt.axhline(0, linestyle='--', color='k', alpha=0.3)
<matplotlib.lines.Line2D at 0x7f667f791c70>
Remove Seasonality#
month_avgs = heater_series.groupby(heater_series.index.month).mean()
month_avgs
Month
1    -0.428360
2    -1.483129
3    -1.063595
4    -0.442926
5    -0.121663
6    -0.128425
7    -0.107093
8     0.075720
9     0.544638
10    1.613170
11    1.183118
12    0.491641
dtype: float64
heater_month_avg = heater_series.index.map(lambda d: month_avgs.loc[d.month])
heater_month_avg
Float64Index([ -1.4831292771766649,  -1.0635953355687688,  -0.4429263710136824,
              -0.12166261572164781, -0.12842542811874377, -0.10709260508002622,
               0.07572031336904021,   0.5446384049209761,   1.6131699911888608,
                1.1831180641276995,
              ...
                0.5446384049209761,   1.6131699911888608,   1.1831180641276995,
                0.4916411242912192,  -0.4283597874466263,  -1.4831292771766649,
               -1.0635953355687688,  -0.4429263710136824, -0.12166261572164781,
              -0.12842542811874377],
             dtype='float64', name='Month', length=197)
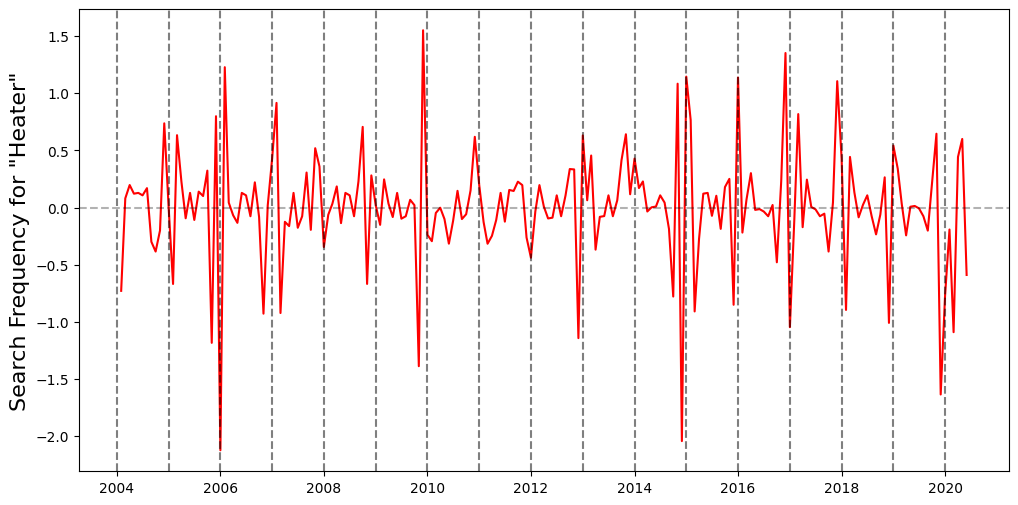
heater_series = heater_series - heater_month_avg
plot_series(heater_series)
plt.axhline(0, linestyle='--', color='k', alpha=0.3)
<matplotlib.lines.Line2D at 0x7f667f579d00>
Perform Deckey Fuller Statistic after each transformation to test for stationarity

